
INSIGHT
Data and evidence show the way
Connect with us
This article was originally published by Water Environment Technology in July 2021.
Authors: Michael F. Lorenzo, P.E., engineer at Bartlett & West and Michelle Neiswender, P.E., project manager at City of Topeka Utilities, Topeka, KS
In its 2021 Report Card for America’s Infrastructure, the American Society of Civil Engineers (ASCE; Reston, Virginia) graded U.S. wastewater treatment and collection systems at D–.
To engineers and municipalities involved daily with this infrastructure, this is not breaking news. Many water resource recovery facilities (WRRFs) and their associated collection systems are nearing or have exceeded their lifespans. Operation and maintenance costs continue to increase, and regulatory requirements continue to become more stringent. At the same time, municipalities have limited resources and must balance their efforts and expenditures to meet a multitude of needs for their residents and realize the greatest benefits from every dollar spent.
To achieve the greatest returns on investment and maximize infrastructure lifespans, the art of asset management is becoming more widespread in the operation, maintenance, and planning of wastewater collection system improvements. Asset management provides a formal framework to decrease reactive responses to emergency conditions through proactive management of collection systems.
In this article, we highlight the story of how the City of Topeka, Kansas, has embraced the principles of asset management. The city has harnessed immense amounts of data to serve as the foundation of a defensible, evidence based decision-making process to guide capital improvement planning for its wastewater collection system.
About the City of Topeka
Topeka is the capital of Kansas and the seat of Shawnee County. The city is located on the Kansas River in the northeast of the state. The city’s reported 2020 U.S. Census population was 125,310, making it the fourth largest city, by population, in Kansas.
The city was established in the 1850s and constructed its first storm drainage sewer in 1878. As the city grew, more sewers were constructed, and by 1899 there were 64.4 km (40 mi) of sewers. As with other similar cities, in its oldest areas the collection system consists of a combined sewer system (CSS). The CSS collects and conveys sanitary, commercial, and industrial wastewater. When it rains, the CSS also collects and conveys stormwater runoff.
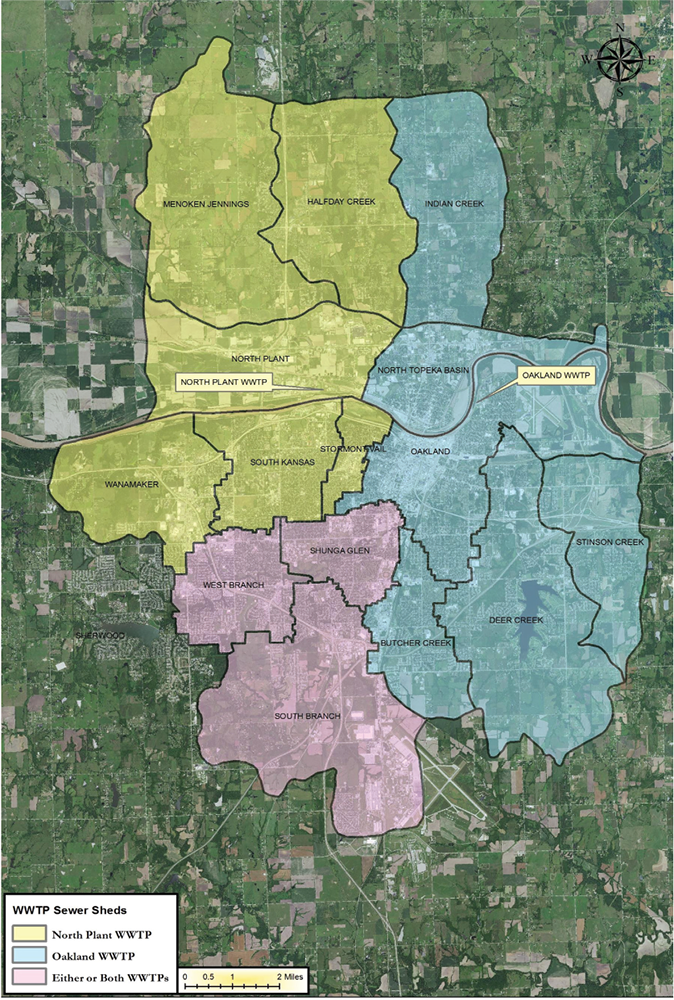
The overall collection system consists of 15 wastewater basins as shown in Figure 1 (p. 35). The total area of all basins is approximately 383 km2 (148 mi2). The two CSS basins, North Topeka, and Oakland, have an area of 46.6 km2 (18 mi2). Two WRRFs provide treatment of flows collected by the system. The 1.05 m3/s (24 million gal/d) peak flow North Plant Wastewater Treatment Plant serves basins in the west and northwest while the 4.38 m3/s (100 million gal/d) peak flow Oakland Wastewater Treatment Plant serves basins in the south, central, and east.
The city’s CSS and sanitary sewer system (SSS) consist of approximately 1,320 km (820 mi) of pipes ranging in diameters from 152.4 mm (6 in.) to 2,438 mm (96 in.).
The oldest sewers were constructed in 1890; but only 15% are 90 years old or older. About 56% were constructed of vitrified clay and 39% were constructed of polyvinyl chloride (PVC) pipe. The remainder were constructed of brick, corrugated metal pipe, reinforced concrete, ductile iron, and prestressed concrete cylinder pipe.
About 76% of the sewer pipes are 200-mm (8-in.) in diameter or less. Of this group of pipes, 57% were constructed of vitrified clay and 42% were constructed of PVC.
Through the 1960s, 89% of the installed pipes were made of vitrified clay. From the 1960s and forward, 82% of the installed pipes were made of PVC. In the last 10 years, 97% of the installed pipe were made of PVC.
Citywide Sewer CCTV
At the end of 2017, the city with the assistance of Bartlett & West (Topeka, Kansas) completed updating their combined sewer overflow (CSO) long-term control plan (LTCP). As part of that work, early action projects were identified, and projects were initiated to clean and rehabilitate major sewers to ensure their structural integrity and improve their hydraulic capacities to enhance peak wet weather capture performance. In addition, the CSO LTCP included provisions for annual assessment as well as pipe lining and replacement projects to concentrate on pipes and manholes with the costliest maintenance histories.
The Citywide Sewer Cleaning and Closed-Circuit Television (CCTV) Inspection Program began at the end of 2018. The goals of the program are to ensure that the operation and maintenance efforts continue to meet permit requirements and desired levels of service. This program was designed and implemented to enable the city to operate proactively and more strategically manage their collection system.
Previously the focus was on areas considered to be known problem areas based on past maintenance history. While the city always has delivered a robust, methodical cleaning schedule that ensures good collection system service and provides general understandings of typical maintenance needs, this new approach offers the opportunity to refine sewer cleaning, and identify and prioritize sewers for ongoing improvement projects.
Program Approach
The program will augment the city’s existing cleaning and maintenance work activities with the collection and analysis of extensive and detailed inspection data. The detailed analyses enable repeatable processes for defensible decision making, capital planning, and prioritization of recommended improvement projects.
Asset management principles are the basis of the guiding strategy for the program. The city wants to avoid running its pipe assets to failure. Rather, it is working to identify pipes that can be rehabilitated before they deteriorate to such a state that expensive emergency repairs and open cut replacements are needed.
Topeka works to answer the following questions for all gravity pipes and manholes. (Force mains are assessed in a separate program.)
- What is the current state of the assets?
- What do we have?
- Where is it?
- What condition is it in?
- What is its remaining useful life?
- Which assets are critical to sustained performance; what are comparative criticality ratings?
- What are required levels of service?
- What are life-cycle costs?
- What is the preferred long-term funding strategy?
Program execution involves three areas of operations throughout the city.
Field operations. This part of the operation oversees sewer cleaning and CCTV inspections, manhole inspections, and field observation assisted by Bartlett & West Inc.
Data analysis and mapping. This part handles data related to pipe cleaning and inspection as well as manhole inspections. The data are reviewed for quality and completeness and assessed using scoring algorithms.
Reporting and project development. This part identifies, develops, and prioritizes work for consideration as part of the City’s Capital Improvement Plan. The choices are based on pipe and manhole scores as well as a decision-making methodology.
Inspection Details
To date, program work has been performed as a series of stand-alone projects comprised of city quarter sections — 64.7 ha (160 ac) each — or groups of contiguous quarter sections. In the first 18 months of the program, which sections to inspect and assess were based on past maintenance history and to coordinate with other known, planned street or utilities improvement projects to encourage synergy and cost savings.
Topeka uses the National Association of Sewer Service Companies (NASSCO) pipeline assessment and certification program and manhole assessment and certification program to describe, record, and rate pipe defect conditions. Manhole inspections are performed to NASSCO’s Level 2 protocol. All pipe segments and manholes and their associated data are linked to the city’s geographic information system (GIS).
During pipe inspections, any emergency conditions prompt immediate calls to the city and emergency repairs are made as soon as feasible. Such conditions include pipes in apparent imminent danger of collapse, for example.
Pipe Scoring
Inspectors compile condition scores for each pipe. These scores are comprised of various pipe defects and observations such as roots, cracks, holes, sags, grease and debris deposits, lateral connections, inflow and infiltration, and joint condition. NASSCO ratings for each type of defect were assigned weighting factors. The total pipe score (TPS) for a pipe is computed by adding up the weighted scores for all observed defects. The TPS also is subdivided to show total scores for operation and maintenance defects and structural defects (STPS).
All total pipe scores are normalized by dividing the compiled scores by pipe length. The purpose of this computation is to ensure that short pipes with low TPSs receive due consideration. This practice prevents bias toward unusually long pipes with high TPS but lower normalized scores.
Manholes are treated similarly, except that scores are not normalized.
For each pipe, the number and type of Level 5 structural defects also are tabulated. Level 5 structural defects of interest are primarily holes with soil visible and severely deformed pipe sections.
The goal of this tabulation is to ensure that pipes with comparatively low TPSs and normalized TPSs that might not be prioritized for improvements would not be neglected from consideration. These pipes are considered for spot repairs.
Project Scoping
Pipes in each section then are prioritized for initial improvement recommendations based on normalized structural condition scores. Planning level cost estimates are developed for recommendations based on a cost tool that provides standard unit costs for
- open cut pipe replacement,
- cast in place pipe (CIPP) lining, and
- spot repairs.
Pipes are prioritized for improvements based on their normalized structural pipe scores. Pipes with the highest normalized structural scores are considered the highest priority for improvements.
The typical cut-off level for recommendation of improvements to a pipe is a cost-effectiveness factor of 1.00. The cost effectiveness factor for each pipe is defined as that pipe’s STPS as a percentage of the STPS for the overall area divided by that pipe’s length as a percentage of the overall area pipe length. The cost-effectiveness factor was developed as a guideline for consistent decision-making and for identifying and selecting for improvement those pipes that would show the most improvement per dollar spent.
The initial pipe recommendations are mapped and reviewed; and intermediate pipes are identified for improvements. Intermediate pipes are those pipes with cost-effectiveness factors less than 1.00 that are directly connected to an upstream pipe and a downstream pipe that are both recommended for improvements. This approach is being taken to ensure that any inflow and infiltration that is decreased will not migrate to adjacent pipes, and to enable improvement scenarios that are more cost-effective to bid and construct.
Projects Identified to Date
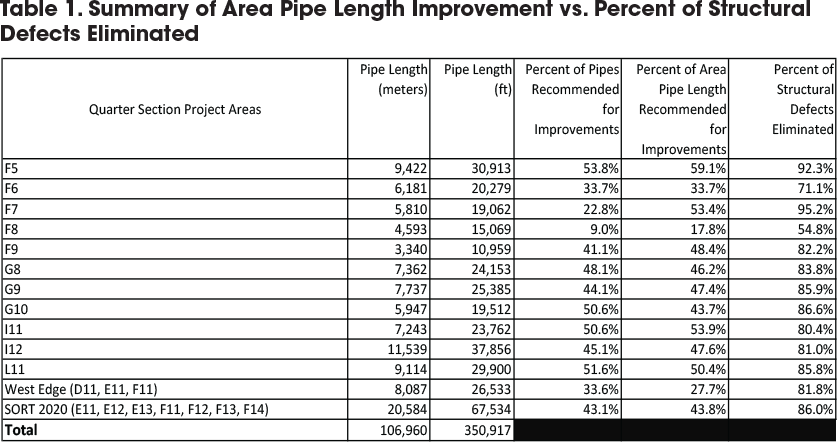
To date, approximately 104,000 m (340,442 ft) of inspected pipes have been assessed. Improvements have been recommended for 44,871 m (147,213 ft) of pipe. Of the pipes recommended for improvements, approximately 9% — 3,957 m (12,983 ft) — were intermediate pipes and pipes with excessive sags.
Overall, 43.2% of the assessed pipes have been recommended for improvements. These projects will eliminate 82.3% of the observed defects in those pipes. Table 1 (p. 36) summarizes the pipe lengths recommended for improvements in the areas analyzed to date and the projected levels of elimination of structural defects.
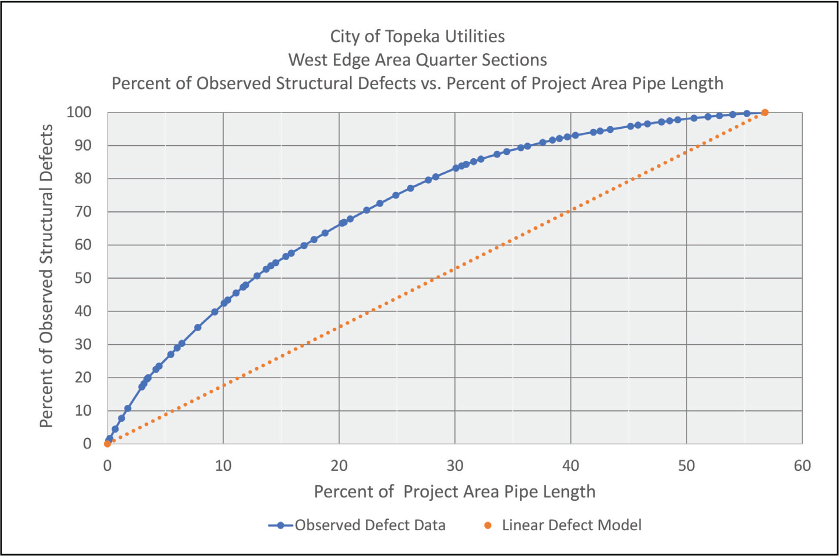
The use of a cost-effectiveness of 1.00 also was assessed through a knee-of-the-curve analysis in which percent of observed structural defects for each area was plotted against precent of project area pipe length. Figure 2 (p. 37) shows an example of this plot for the West Edge project area.
Figure 2 shows a comparison between the actual observed conditions, and the improvements that might be expected if structural defects were evenly distributed throughout the area pipes. The inflection point of the observed defect data is found to occur at approximately 26% of the project area pipe length and is associated with elimination of 46% of structural defects.
This correlates to a pipe in the West Edge area with a cost-effectiveness factor of about 2.95. Similar results are obtained for the other project areas. Therefore, the cost-effectiveness factor of 1.00 is conservative in that it is generally somewhat past the knee-of-the-curve. (The development of manhole improvement recommendations was performed similarly to pipes although a cost-effectiveness factor was not used.)
At this stage of development of the program, the general level of cost-effectiveness is considered reasonable, and the city plans to assess post-construction performance for removal of inflow and infiltration. As the program progresses, the cost-effectiveness factor will be periodically reassessed and may be adjusted.
 |
Implementation Order
After recommended improvements were developed for each quarter section and quarter section group, the next step was to prioritize the implementation of improvements. Prioritization is performed using consolidated business risk exposure (BRE) scores and overall quarter section defect ratings. The consolidated BRE score is the sum of the pipe BREs in each quarter section. The overall defect rating of each quarter section is computed based on the total structural defect score of a quarter section divided by pipe inch-miles in the quarter section.
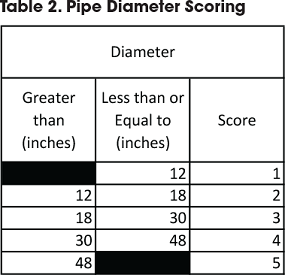
The BRE score is based on pipe criticality. Criticality is calculated based on selected pipe characteristics and social and environmental factors for each pipe. Pipe characteristics that are used in scoring are diameter, length, age in years, remaining useful life, inverted siphon, rail crossings, highway crossings, major street crossings, location in right-of-way (ROW) or off-ROW, presence of linings or coatings, and position relative to other pipes in the collection system. The position of a pipe in the collection system is known as network criticality. Each pipe is rated by the cumulative total of upstream pipe inch-miles tributary to it. Table 2 (p. 38) provides an example of how pipes are scored for diameter. Scores range from 1 for least critical to 5 for most critical.
 /
/
Social and environmental factors consider a pipe’s proximity to defined features and associates a score with each feature. Social and environmental factors consist of checking and scoring for proximity to major and small waterbodies, hospitals, nursing homes, police stations, prisons, schools and universities, interstate highways, and any infrastructure identified as critical.
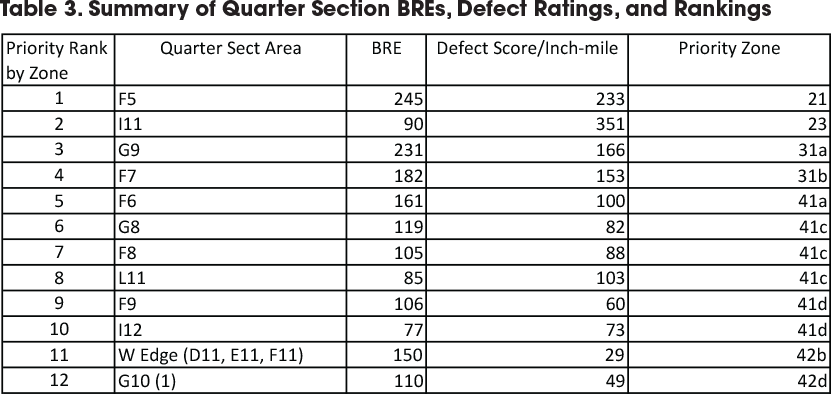
Table 3 (p. 38) summarizes the BREs, overall defect scores, and priority rankings of the 11 areas. The consolidated BRE and overall quarter section defect ratings for each quarter section are plotted on a graph to identify quarter sections with the highest overall risk in terms of consequences of failure (BRE) and likelihood of failure (overall defect rating). Figure 3 (below) presents BRE versus overall defect rating for 11 quarter section areas and the West Edge area project.
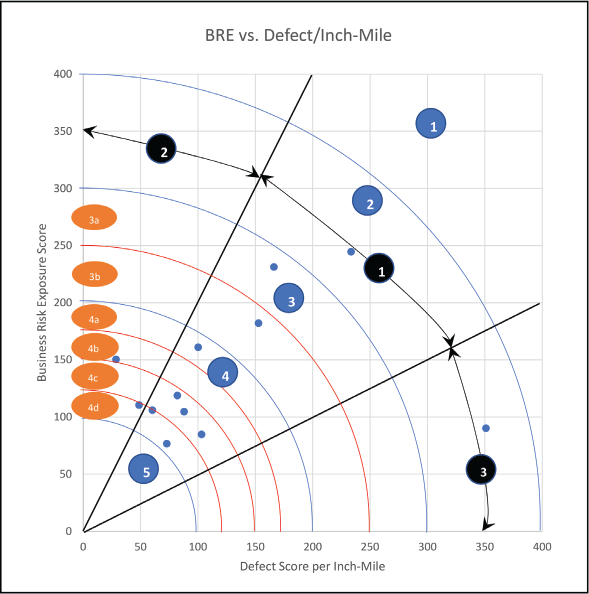
Figure 3 is divided into major risk zones, major risk zone sectors, and major risk subzones. The lower the number and number-letter combination, the higher the risk is considered. Therefore, major risk zone 1 has the highest criticality; risk sub-zone 4a is more critical than risk sub-zone 4b; major risk zone 5 is the least critical. The risk zones were developed to enable a more balanced consideration of areas with high overall defect ratings and low BRE scores against areas with high BREs and lower overall defect ratings.
As the program progresses, the city plans to periodically reassess the delineation of the risk zones and adjust as they may see fit.
The next steps in the process are to incorporate the highest priority projects into the city capital improvement plan, initiate design work, refine the planning level costs estimates, implement construction projects, and assess the effects of the improvements on the performance of the collection system.
Program Benefits
The methodology outlined here provides Topeka with powerful tools. They enable to city to make methodical analyses and defensible prioritized improvement recommendations that can be implemented in a financially sustainable fashion while maintaining regulatory requirements and level of service standards.
As the program has progressed, findings to date are being used to develop advanced and more rigorous criteria for prioritizing the next sections for cleaning and inspection based on their predicted comparative operational performance, and overall failure probability. But that is a story for another day. Stay tuned.
Michael F. Lorenzo, P.E., is a Senior Project Manager for Bartlett & West, Inc. with headquarters in Topeka, Kansas. Michelle Neiswender, P.E., is a Project Manager for City of Topeka Utilities in Topeka, Kansas.
Tell us about your project
We’d love to work with you. Tell us the services you are seeking and one of our team members will connect with you.